
Loans
Get affordable financing for your ideal space, inventory, and more.

A new website and mobile app is here!
It could be your lucky day, month or year! Someone has to win, and that someone could be you!
Get affordable financing for your ideal space, inventory, and more.
Seize opportunities as they arise with more spending flexibility.
Streamline your cash flow management, payables, and receivables.
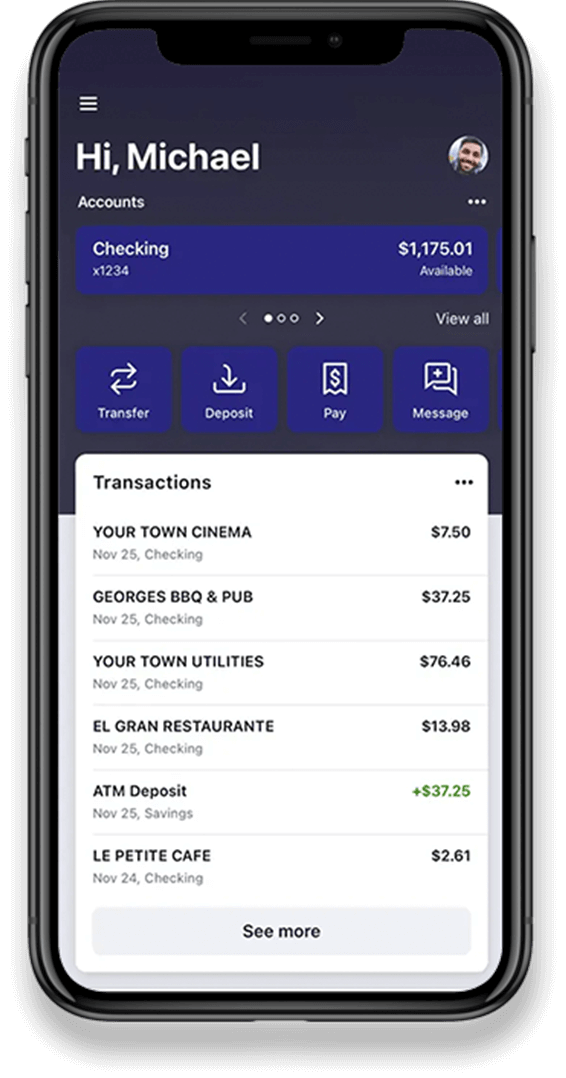
Your nearest BRB branch is in your pocket. View your balance, deposit checks, and more.
Fewer trips to the branch means more time for other parts of your business.
Discover the exclusive benefits of our checking for customers age 55 and better. You’ll enjoy discounts and travel opportunities!